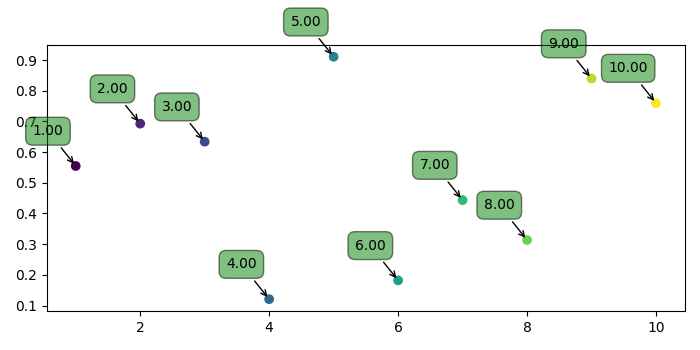
如何在 Matplotlib 中将注释水平居中在某个点上?
matplotlibserver side programmingprogramming更新于 2025/4/30 12:07:17
要将注释水平居中在某个点上,我们可以采取以下步骤−
- 使用 numpy 为 x 和 y 创建点。
- 使用 xpoints 创建标签。
- 使用 scatter() 方法散布点。
- 迭代标签、xpoints 和 ypoints,并使用具有不同属性的标签、x 和 y 注释绘图,使水平对齐 ha=center。
- 要显示图形,请使用 show() 方法。
示例
import numpy as np
from matplotlib import pyplot as plt
plt.rcParams["figure.figsize"] = [7.00, 3.50]
plt.rcParams["figure.autolayout"] = True
xpoints = np.linspace(1, 10, 10)
ypoints = np.random.rand(10)
labels = ["%.2f" % i for i in xpoints]
plt.scatter(xpoints, ypoints, c=xpoints)
for label, x, y in zip(labels, xpoints, ypoints):
plt.annotate(
   label,
   xy=(x, y), xytext=(-20, 20),
   textcoords='offset points', ha='center', va='bottom',
   bbox=dict(boxstyle='round,pad=0.5', fc='green', alpha=0.5),
   arrowprops=dict(arrowstyle='->', connectionstyle='arc3,rad=0'))
plt.show()
输出