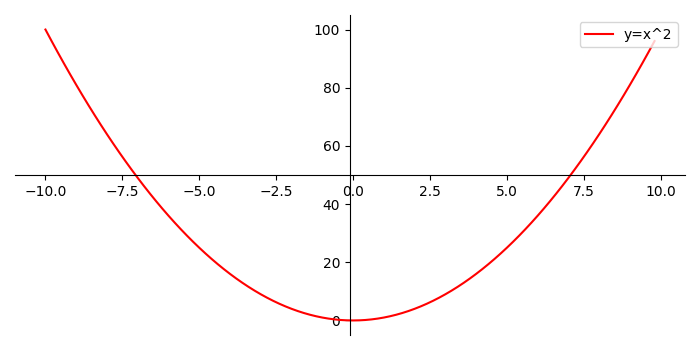
如何在 Matplotlib 中在图形中间绘制轴?
matplotlibserver side programmingprogramming更新于 2025/4/30 16:37:17
要在图形中间绘制轴,我们可以采取以下步骤 −
使用 numpy 创建 x 和 sqr 数据点。
使用 figure() 方法创建新图形或激活现有图形。
将轴添加到图形作为子图布置的一部分。
设置左侧和底部脊柱的位置。
设置右侧和顶部脊柱的颜色。
使用 plot() 方法绘制 x 和 sqr,并带有标签y=x2 和 color=red。
使用 legend() 方法放置图例。将位置设置在右上角。
要显示图形,请使用 show() 方法。
示例
import numpy as np
import matplotlib.pyplot as plt
plt.rcParams["figure.figsize"] = [7.00, 3.50]
plt.rcParams["figure.autolayout"] = True
x = np.arange(-10., 10., 0.2)
sqr = np.square(x)
fig = plt.figure()
ax = fig.add_subplot(1, 1, 1)
ax.spines['left'].set_position('center')
ax.spines['bottom'].set_position('center')
ax.spines['right'].set_color('none')
ax.spines['top'].set_color('none')
plt.plot(x, sqr, label="y=x^2", c='red')
plt.legend(loc=1)
plt.show()
输出