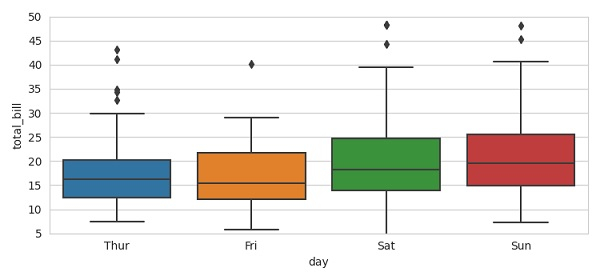
如何使用 Matplotlib 设置 Seaborn 箱线图的 Y 轴范围?
matplotlibserver side programmingprogramming更新于 2025/7/5 22:22:17
要设置 Seaborn 箱线图的 Y 轴范围,我们可以采取以下步骤 −
使用 set_style() 方法设置绘图的美观样式。
使用 load_dataset("tips"); 加载数据集(需要网络连接)。
使用 boxplot() 绘制箱线图以显示类别分布。
要设置 Y 轴范围,请使用 ylim() 方法。
要显示图形,请使用 show() 方法。
示例
from matplotlib import pyplot as plt
import seaborn as sns
plt.rcParams["figure.figsize"] = [7.50, 3.50]
plt.rcParams["figure.autolayout"] = True
sns.set_style("whitegrid")
tips = sns.load_dataset("tips")
ax = sns.boxplot(x="day", y="total_bill", data=tips)
plt.ylim(5, 50)
plt.show()
输出