Matplotlib 子图中的图例
matplotlibserver side programmingprogramming更新于 2025/8/3 1:52:17
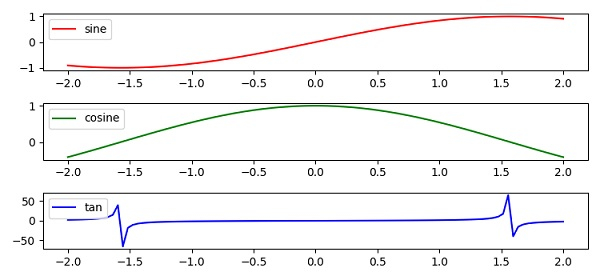
要在子图中添加图例,我们可以执行以下步骤 −
使用 numpy 创建点 x、y1、y2 和 y3。
使用 subplots() 方法创建一个图形和一组子图,考虑 3 个子图。
在所有子图(3 个)上绘制曲线,并使用不同的标签和颜色。要为每条曲线或子图添加图例,请添加标签。
要为每条曲线启用标签,请使用 legend() 方法。
要显示图形,请使用 show() 方法。
示例
import numpy as np
from matplotlib import pyplot as plt
plt.rcParams["figure.figsize"] = [7.50, 3.50]
plt.rcParams["figure.autolayout"] = True
x = np.linspace(-2, 2, 100)
y1 = np.sin(x)
y2 = np.cos(x)
y3 = np.tan(x)
f, axes = plt.subplots(3)
axes[0].plot(x, y1, c='r', label="sine")
axes[0].legend(loc='upper left')
axes[1].plot(x, y2, c='g', label="cosine")
axes[1].legend(loc='upper left')
axes[2].plot(x, y3, c='b', label="tan")
axes[2].legend(loc='upper left')
plt.show()
输出