Matplotlib savefig 函数,图例在绘图外部
matplotlibserver side programmingprogramming更新于 2025/7/30 0:22:17
要保存图例在绘图外部的文件,我们可以执行以下步骤 −
使用 numpy 创建 x 个数据点。
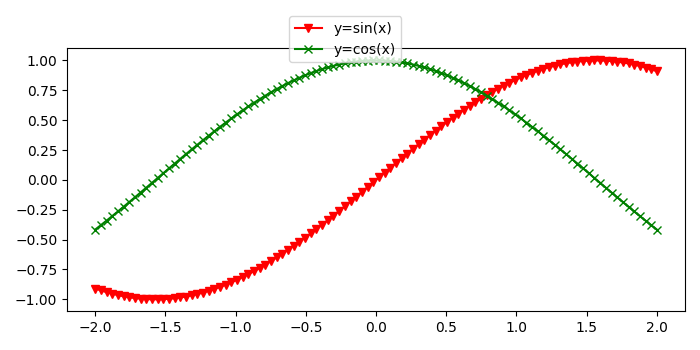
使用 plot() 方法绘制 y=sin(x) 曲线,颜色为 red,标记 v,标签为 y=sin(x)。
使用 plot() 方法绘制 y=cos(x) 曲线,颜色为 green,标记 x,标签为y=cos(x)。
要将图例放置在图外,请使用 bbox_to_anchor(.45, 1.15) 和 location="upper center"。
要保存图形,请使用 savefig() 方法。
示例
import numpy as np
from matplotlib import pyplot as plt
plt.rcParams["figure.figsize"] = [7.00, 3.50]
plt.rcParams["figure.autolayout"] = True
x = np.linspace(-2, 2, 100)
plt.plot(x, np.sin(x), c="red", marker="v", label="y=sin(x)")
plt.plot(x, np.cos(x), c="green", marker="x", label="y=cos(x)")
plt.legend(bbox_to_anchor=(.45, 1.15), loc="upper center")
plt.savefig("legend_outside.png")
输出
执行此代码后,将在当前目录中保存名为"legend_outside.png"的以下绘图。