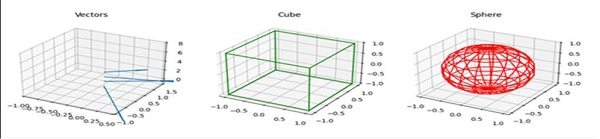
在 Matplotlib 中绘制 3D 立方体、球体和矢量
matplotlibserver side programmingprogramming更新于 2025/8/30 10:22:17
从 plt.figure() 获取 fig,并使用 add_subplot 创建三个不同的坐标轴,其中 projecting=3d。
使用 ax.set_title("name of the figure") 设置图形标题。使用 ax.quiver 方法绘制矢量投影,使用 plot3D 方法绘制立方体,使用 plot_wireframe 方法绘制球体(使用 sin 和 cos 函数)。
步骤
创建一个新图形,或激活一个现有图形。
要绘制矢量,请获取一个二维数组。
获取一个压缩对象。
将 ~.axes.Axes 文件添加到图形中作为子图布局的一部分,并进行三维投影,其中 nrows = 1、ncols = 3 和 index = 1。
绘制一个由箭头组成的三维场。
设置 xlim、ylim 和 zlim。
设置轴的标题(在索引处) 1).
将 ~.axes.Axes 添加到图形中,作为子图排列的一部分,使用 3D 投影,其中 nrows = 1、ncols = 3 且 index = 2。
使用 plot3D() 创建曲面图,其中曲面和边使用绿色传递。
设置轴的标题(在索引 2 处)。例如,"立方体"。
将 ~.axes.Axes 添加到图形中,作为子图排列的一部分,使用 3D 投影,其中 nrows = 1、ncols = 3 且 index = 3。
使球体的正弦和余弦曲线位于同一位置。
设置轴的标题(在索引 3 处),例如,"球体"。
要显示绘图,请使用 plt.show() 方法。
示例
import matplotlib.pyplot as plt
import numpy as np
from itertools import product, combinations

fig = plt.figure()

# 绘制向量
soa = np.array([[0, 0, 1, 1, -2, 0], [0, 0, 2, 1, 1, 0],
               [0, 0, 3, 2, 1, 0], [0, 0, 4, 0.5, 0.7, 0]])

X, Y, Z, U, V, W = zip(*soa)
ax = fig.add_subplot(131, projecting='3d')
ax.quiver(X, Y, Z, U, V, W)
ax.set_xlim([-1, 0.5])
ax.set_ylim([-1, 1.5])
ax.set_zlim([-1, 8])
ax.set_title("Vectors")

# 绘制立方体
ax = fig.add_subplot(132, project='3d')
r = [-1, 1]
for s, e in combinations(np.array(list(product(r, r, r))), 2):
   if np.sum(np.abs(s-e)) == r[1]-r[0]:
      ax.plot3D(*zip(s, e), color="green")
ax.set_title("Cube")

# 绘制球体
ax = fig.add_subplot(133, projection='3d')
u, v = np.mgrid[0:2*np.pi:20j, 0:np.pi:10j]
x = np.cos(u)*np.sin(v)
y = np.sin(u)*np.sin(v)
z = np.cos(v)
ax.plot_wireframe(x, y, z, color="red")
ax.set_title("Sphere")

plt.show()
输出