使用 Matplotlib 在 Seaborn 箱线图中旋转 xtick 标签
matplotlibserver side programmingprogramming更新于 2025/9/12 10:07:17
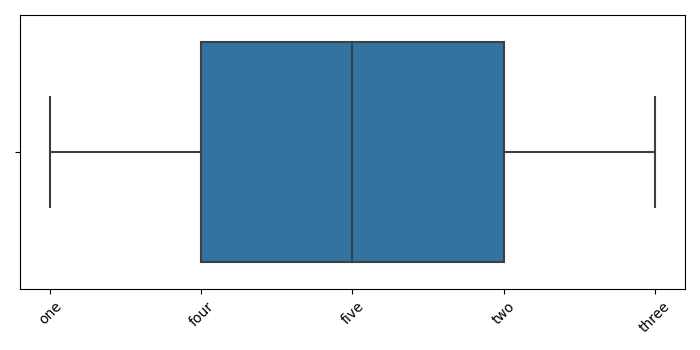
要在 Seaborn 箱线图中旋转 xtick 标签,我们可以采取以下步骤 −
为 xticks 创建数据点。
使用返回轴的 boxplot() 方法绘制箱线图。
现在,使用 set_xticks() 方法设置 xticks,并传递 xticks。
设置 xticklabels 并传递一个标签列表,然后使用 set_xticklabels() 方法传递 rotation=45 来旋转它们。
要显示图形,请使用 show() 方法。
示例
import seaborn as sns
from matplotlib import pyplot as plt
plt.rcParams["figure.figsize"] = [7.00, 3.50]
plt.rcParams["figure.autolayout"] = True
xticks = [1, 4, 5, 2, 3]
ax = sns.boxplot(xticks)
ax.set_xticks(xticks)
ax.set_xticklabels(["one", "two", "three", "four", "five"], rotation=45)
plt.show()
输出