在 matplotlib 中将图表保存为 PDF 格式
matplotlibserver side programmingprogramming更新于 2025/9/12 11:52:17
使用 plt.savefig("myImagePDF.pdf", format="pdf", bbox_inches="tight") 方法,我们可以将图表保存为 PDF 格式。
步骤
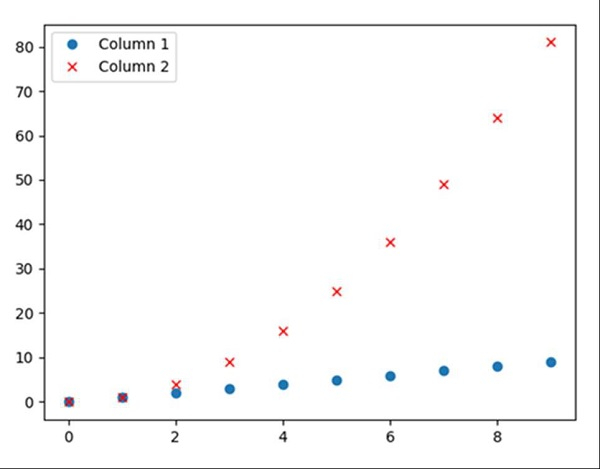
创建一个字典,以第 1 列和第 2 列为键,值分别为 i 和 i*i,其中 i 分别取值 0 到 10。
使用 pd.DataFrame(d) 创建数据框,d 在步骤 1 中创建。
使用"o"和"rx"样式绘制数据框。
要将文件保存为 PDF 格式,请使用 savefig() 方法,其中图像名称为 myImagePDF.pdf,格式为 "pdf"。
要显示图像,请使用 plt.show() 方法。
示例
import pandas as pd
from matplotlib import pyplot as plt

d = {'Column 1': [i for i in range(10)], 'Column 2': [i * i for i in range(10)]}

df = pd.DataFrame(d)

df.plot(style=['o', 'rx'])
plt.savefig("myImagePDF.pdf", format="pdf", bbox_inches="tight")
plt.show()
输出