Matplotlib 中的文本框换行功能
matplotlibserver side programmingprogramming更新于 2025/9/17 12:22:17
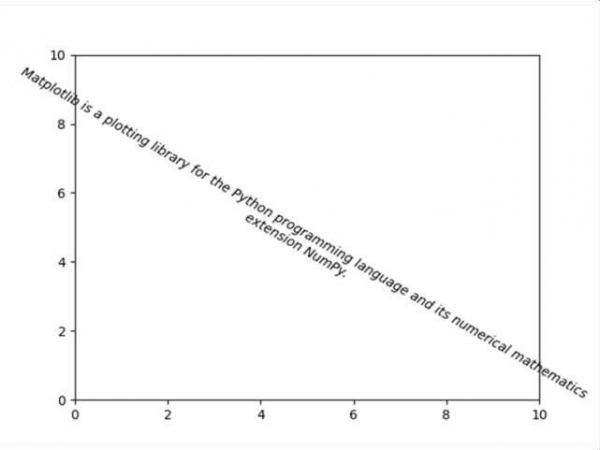
Matplotlib 可以自动换行,但如果文本过长,文本仍然会略微超出轴的边界。
步骤
使用 figure() 创建新图形或激活现有图形。
使用 plt.axis() 方法设置轴的属性。
创建一个变量 input_text 来存储字符串。
使用 plt.text() 方法向图形添加文本,其中 style='oblique', ha='center', va='top', ...etc.
要显示图形,请使用 plt.show() 方法。
示例
import matplotlib.pyplot as plt

fig = plt.figure()
plt.axis([0, 10, 0, 10])
input_text = 'Matplotlib is a plotting library for the Python programming
language and its numerical mathematics extension NumPy.'
plt.text(5, 5, input_text, fontsize=10, style='oblique', ha='center', va='top', wrap=True, rotation=-30)

plt.show()
输出