Matplotlib 中的 add_axes 和 add_subplot 有什么区别?
matplotlibserver side programmingprogramming更新于 2025/10/8 14:37:17
定义
add_axes − 向图形添加坐标区。
add_subplot − 向图形添加坐标区,作为子图排列的一部分。
步骤
使用 figure() 方法创建新图形或激活现有图形。
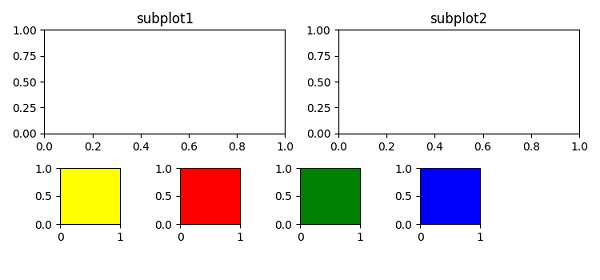
向图形添加坐标区,作为子图排列的一部分,其中 nrows=2, ncols=2。在索引 1 处,添加标题"subtitle1"并在索引 2 处添加标题"subplot2"。
为四个矩形创建点,并使用 add_axes()方法向图形添加轴。
要显示图形,请使用show()方法。
示例
from matplotlib import pyplot as plt
plt.rcParams["figure.figsize"] = [7.50, 3.50]
plt.rcParams["figure.autolayout"] = True
fig = plt.figure()
fig.add_subplot(221)
plt.title("subplot1")
fig.add_subplot(222)
plt.title("subplot2")
rect1 = .1, .2, .1, .2
rect2 = .3, .2, .1, .2
rect3 = .5, .2, .1, .2
rect4 = .7, .2, .1, .2
fig.add_axes(rect1, facecolor="yellow")
fig.add_axes(rect2, facecolor="red")
fig.add_axes(rect3, facecolor="green")
fig.add_axes(rect4, facecolor="blue")
plt.show()
输出