目前在 Jupyter/iPython 中动态更新图表的正确方法是什么?
matplotlibserver side programmingprogramming更新于 2025/10/10 0:37:17
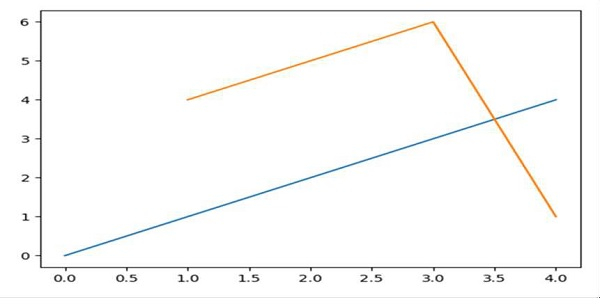
我们可以首先使用 plt.ion() 方法激活该图形。然后,我们可以用不同的值集更新绘图。
步骤
使用 subplots 方法创建 fig 和 ax 变量,其中默认的 nrows 和 ncols 为 1。
使用 plot() 方法绘制一条线。
设置线的颜色,例如橙色。
使用 plt.ion() 方法激活交互。
要使绘图具有交互性,请更改线的坐标。
示例
In [1]: %matplotlib auto

Using matplotlib backend: GTK3Agg

In [2]: import matplotlib.pyplot as plt

# 图表将获得弹出了。让我们更新图表。
In [3]: fig, ax = plt.subplots()

# 绘制一条线
In [4]: ax.plot(range(5))

In [5]: plt.ion()

# 用新线更新图形。
In [6]: ax.plot([1, 3, 4], [4, 6, 1])
输出