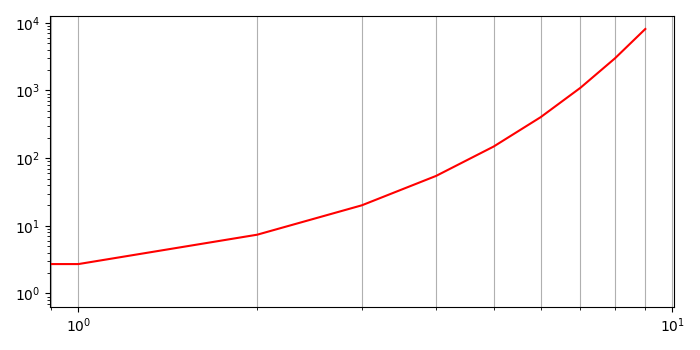
如何使用 Matplotlib 在对数对数图上显示所有刻度处的对数间隔网格线?
matplotlibserver side programmingprogramming更新于 2025/4/30 11:52:17
要使用 matplotlib 在对数对数图上显示所有刻度处的对数间隔网格线,我们可以采取以下步骤−
- 使用 numpy 为 x 和 y 创建数据点。
- 使用 loglog 方法,在 X 轴和 Y 轴上绘制具有对数缩放的图。
- 使用 grid() 方法,以当前线条样式布置网格。提供 x 和 y 位置的列表。
- 要显示图形,请使用 show() 方法。
示例
import numpy as np
from matplotlib import pyplot as plt
plt.rcParams["figure.figsize"] = [7.00, 3.50]
plt.rcParams["figure.autolayout"] = True
x = np.arange(0, 10, 1)
y = np.exp(x)
plt.loglog(x, y, c='r')
plt.grid(True, which="both", axis='x')
plt.show()
输出