使用 Matplotlib 设置 Seaborn 热图上颜色条的最大值
matplotlibserver side programmingprogramming更新于 2025/9/12 9:52:17
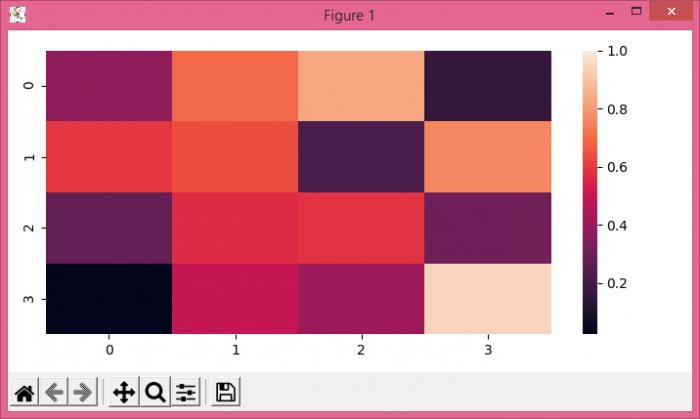
要设置 Seaborn 热图上颜色条的值,我们可以采取以下步骤Ⅹ
- 使用 numpy 创建随机数据。
- 使用 heatmap() 方法将矩形数据绘制为颜色编码矩阵。
- 要显示该图,请使用 show() 方法。
示例
import numpy as np
import seaborn as sns
from matplotlib import pyplot as plt
plt.rcParams["figure.figsize"] = [7.00, 3.50]
plt.rcParams["figure.autolayout"] = True
data = np.random.rand(4, 4)
ax = sns.heatmap(data, vmax=1)
plt.show()
输出