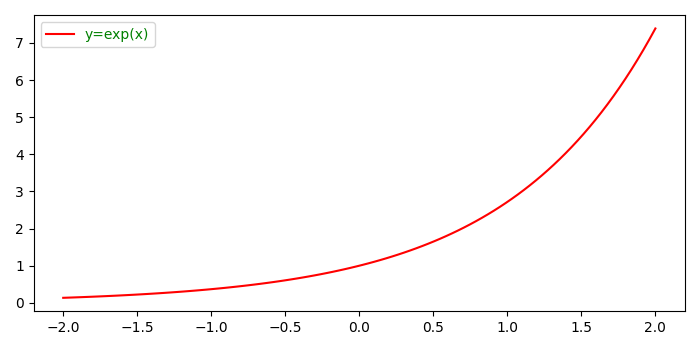
如何使用 Matplotlib 更改图例中字体的文本颜色?
matplotlibserver side programmingprogramming更新于 2025/4/30 18:37:17
要更改 matplotlib 中图例中字体的文本颜色,我们可以采取以下步骤−
- 使用 numpy 创建 x 和 y 数据点。
- 使用 plot() 方法绘制 x 和 y,其中线条颜色为红色,标签为 "y=exp(x)"。
- 要放置图例,请使用 legend() 方法和图例位置并存储返回值以设置文本的颜色。
- 要设置文本的颜色,请使用 set_color() 方法和绿色。
- 要显示图形,请使用 show() 方法。
示例
import numpy as np
from matplotlib import pyplot as plt
plt.rcParams["figure.figsize"] = [7.00, 3.50]
plt.rcParams["figure.autolayout"] = True
x = np.linspace(-2, 2, 100)
y = np.exp(x)
plt.plot(x, y, label="y=exp(x)", c='red')
leg = plt.legend(loc='upper left')
for text in leg.get_texts():
text.set_color("green")
plt.show()
输出