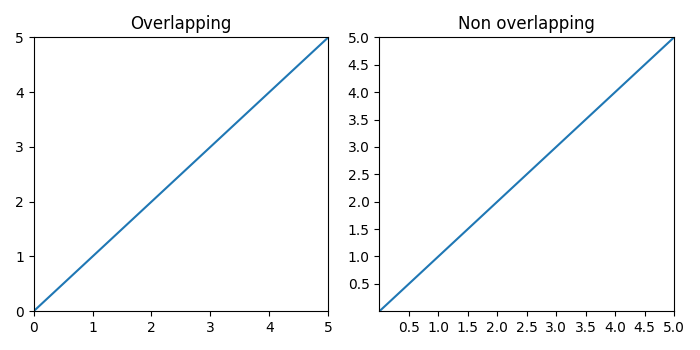
Matplotlib 中 Y 轴刻度标签和 X 轴刻度标签重叠
matplotlibserver side programmingprogramming更新于 2025/7/30 1:22:17
为了减少 matplotlib 中 x 和 y 刻度标签重叠的可能性,我们可以采取以下步骤 −
使用 numpy 创建 x 和 y 数据点。
在索引 1 处向当前图形添加子图 (nrows=1 和 ncols=2)。
将 x 和 y 边距设置为 0。
绘制 x 和y 数据点,并为此子图添加标题,即"重叠"。
在索引 2 处的当前图形中添加一个子图(nrows=1 且 ncols=2)。
将 x 和 y 边距设置为 0。
绘制 x 和 y 数据点,并为此子图添加标题,即"不重叠"。
MaxNLocator 和 prune ="lower" 的目标是删除最小的刻度。
要显示图形,请使用 show() 方法。
示例
import matplotlib.pyplot as plt
from matplotlib.ticker import MaxNLocator
import numpy as np
plt.rcParams["figure.figsize"] = [7.00, 3.50]
plt.rcParams["figure.autolayout"] = True
xs = np.linspace(0, 5, 10)
ys = np.linspace(0, 5, 10)
plt.subplot(121)
plt.margins(x=0, y=0)
plt.plot(xs, ys)
plt.title("Overlapping")
plt.subplot(122)
plt.margins(x=0, y=0)
plt.plot(xs, ys)
plt.title("Non overlapping")
plt.gca().xaxis.set_major_locator(MaxNLocator(prune='lower'))
plt.gca().yaxis.set_major_locator(MaxNLocator(prune='lower'))
plt.show()
输出