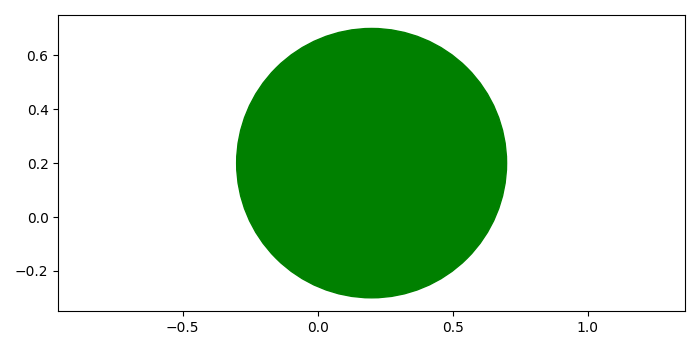
如何在 Matplotlib 中绘制圆形?
matplotlibserver side programmingprogramming更新于 2025/7/3 21:52:17
要在 Matplotlib 中绘制圆形,我们可以执行以下步骤 −
使用 figure() 方法创建一个新图形或激活一个现有图形。
在当前轴上添加子图排列。
使用 Circle 类在中心创建一个真正的圆形。
在当前轴上添加一个面片。
设置 x 轴和 y 轴的界限。
要显示图形,请使用 show() 方法。
示例
from matplotlib import pyplot as plt, patches
plt.rcParams["figure.figsize"] = [7.00, 3.50]
plt.rcParams["figure.autolayout"] = True
fig = plt.figure()
ax = fig.add_subplot()
circle1 = patches.Circle((0.2, 0.2), radius=0.5, color='green')
ax.add_patch(circle1)
ax.axis('equal')
plt.show()
输出