如何在 Matplotlib 中使用 pyplot.plot 去除圆形标记的轮廓?
matplotlibserver side programmingprogramming更新于 2025/7/4 10:52:17
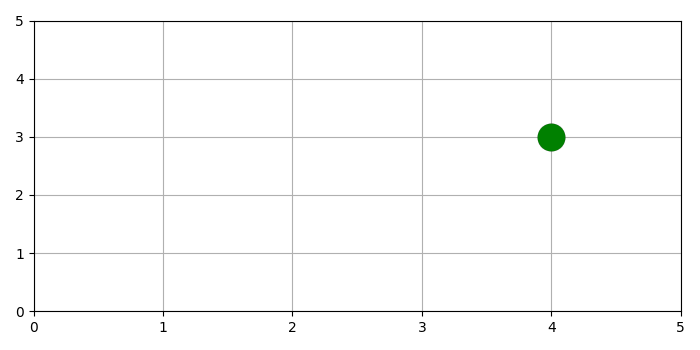
要去除圆形标记的轮廓,我们可以减小标记边缘宽度的值。
使用单个值初始化 x 和 y 的列表。
将 x 和 y 轴的范围限制为 0 到 5。
以当前线条样式布局网格。
使用 plot() 方法绘制给定的 x 和 y ,其中 marker="o" markeredgecolor="red"、markerfacecolor="green" 和最小 markeredgewidth 来移除轮廓。
要显示图形,请使用 show() 方法。
示例
from matplotlib import pyplot as plt
plt.rcParams["figure.figsize"] = [7.00, 3.50]
plt.rcParams["figure.autolayout"] = True
x = [4]
y = [3]
plt.xlim(0, 5)
plt.ylim(0, 5)
plt.grid()
plt.plot(x, y, marker="o", markersize=20, markeredgecolor="black", markerfacecolor="green", markeredgewidth=.1)
plt.show()
输出