使用 matplotlib 面向对象接口通过 seaborn 进行绘图
matplotlibserver side programmingprogramming更新于 2025/8/30 18:37:17
Seaborn 用于可视化随机分布,我们可以使用 matplotlib 接口在图表上显示此分布。
我们可以按照以下步骤显示图表 −
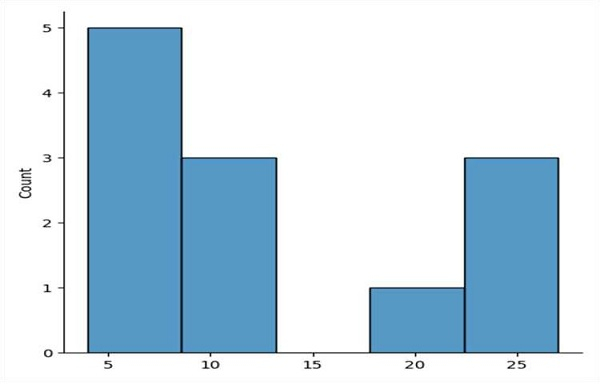
用于在面网格上绘制分布图的图形级接口。此函数提供了多种可视化数据单变量或双变量分布的方法,包括通过语义映射和跨多个子图进行分面定义的数据子集。
可以在上述定义的方法 displot() 中传递数字列表。
要显示图表,可以使用 plt.show(),而图是使用 Seaborn 绘制的。
示例
导入 matplotlib.pyplot 作为 plt
导入 seaborn 作为 sns

sns.displot([4, 5, 6, 7, 8, 9, 10, 11, 21, 23, 25, 27])

plt.show()
输出