在 matplotlib 中使用 plot、axes 或 figure 绘制图表有什么区别?
matplotlibserver side programmingprogramming更新于 2025/10/10 8:07:17
让我们通过一个例子来理解 plot、axes 和 figure 之间的区别。
Plot − Plot 有助于绘制具有 (x, y) 坐标的单个图表。
Axes − Axes 有助于在同一窗口中绘制一个或多个图表,并设置 figure 的位置。
Figure −此方法为所有绘图元素提供了一个顶级容器。
我们可以按照以下步骤复制它们之间的差异 −
使用 plt.figure() 创建一个新图形或激活一个现有图形。
使用 plt.add_subplot(xyz) 将轴添加到图形作为子图排列的一部分,其中 x 为行数,y 为列数,z 为索引。这里取 x = 1(行数)、y = 2(列数)和 z = 1(位置)。
绕过列表,将线段绘制到 plt.plot() 方法中。
要显示图表,请使用 plt.show() 方法。
示例
我们将在以下代码中使用 plot、axes 和 figure −
import matplotlib.pyplot as plt

fig = plt.figure()             # Activating figure

ax1 = fig.add_subplot(121)     # Setting up figure position

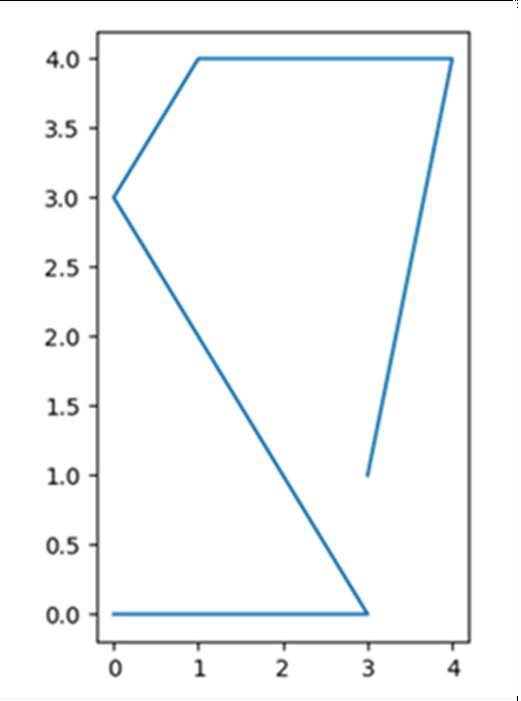
plt.plot([3, 4, 1, 0, 3, 0], [1, 4, 4, 3, 0, 0]) # Drawing lines in the
activated figure.

plt.show()
输出