在 Matplotlib 绘图的轴上显示小数和科学计数法
matplotlibserver side programmingprogramming更新于 2025/9/12 2:37:17
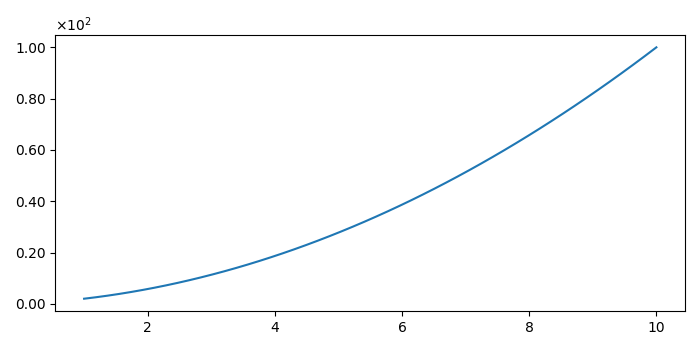
要在 Matplotlib 的轴上显示小数和科学计数法,我们可以通过重写 _set_format() 方法来使用标量格式化程序。
步骤
使用 numpy 创建 x 和 y 数据点。
使用 plot() 方法绘制 x 和 y 坐标。
使用 gca() 方法获取当前轴。
将格式刻度值实例化为数字类,即 ScalarFormatter。
使用以下方法设置科学计数法的大小阈值set_powerlimits((0, 0)) 方法。
使用 set_major_formatter() 方法设置主要股票代码的格式化程序。
要显示图表,请使用 show() 方法。
示例
import numpy as np
from matplotlib.ticker import ScalarFormatter
from matplotlib import pyplot as plt
plt.rcParams["figure.figsize"] = [7.00, 3.50]
plt.rcParams["figure.autolayout"] = True

class ScalarFormatterClass(ScalarFormatter):
   def _set_format(self):
      self.format = "%1.2f"

x = np.linspace(1, 10)
y = np.linspace(2,10)
y = x * y
plt.plot(x, y)
ax = plt.gca()
yScalarFormatter = ScalarFormatterClass(useMathText=True)
yScalarFormatter.set_powerlimits((0,0))
ax.yaxis.set_major_formatter(yScalarFormatter)
plt.show()
输出