使用 setp 在 Matplotlib 紧密布局中包裹长 Y 标签
matplotlibserver side programmingprogramming更新于 2025/10/7 16:22:17
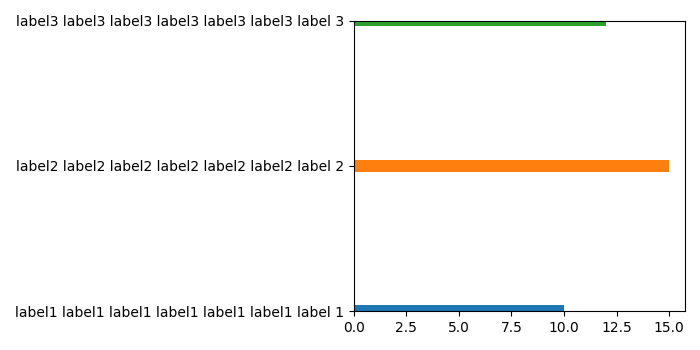
要使用 setp 在 Matplotlib 紧密布局中包裹长 Y 标签,我们可以采取以下步骤−
- 创建一个长字符串列表。
- 创建一个包含 3 个值的元组。
- 创建一个图形并添加一组子图。
- 使用 ylim() 方法限制 Y 轴刻度。
- 使用 barh() 方法绘制水平条形图。
- 使用 yticks() 方法设置 y 轴刻度。
- 使用 setp() 方法设置 Artist 对象的属性。
- 使用 tight_layout() 方法调整填充在子图之间和周围。
- 要显示该图,请使用 show() 方法。
示例
import numpy as np
import matplotlib.pyplot as plt
plt.rcParams["figure.figsize"] = [7.00, 3.50]
plt.rcParams["figure.autolayout"] = True
labels = (
   'label1 label1 label1 label1 label1 label1 label 1',
   'label2 label2 label2 label2 label2 label2 label 2',
   'label3 label3 label3 label3 label3 label3 label 3')
values = (10, 15, 12)
fig, ax = plt.subplots()
plt.ylim((0, 20))
for i in np.arange(3):
plt.barh(10 * i, values[i])
plt.yticks(10 * np.arange(3))
plt.setp(ax.set_yticklabels(labels))
plt.show()
输出